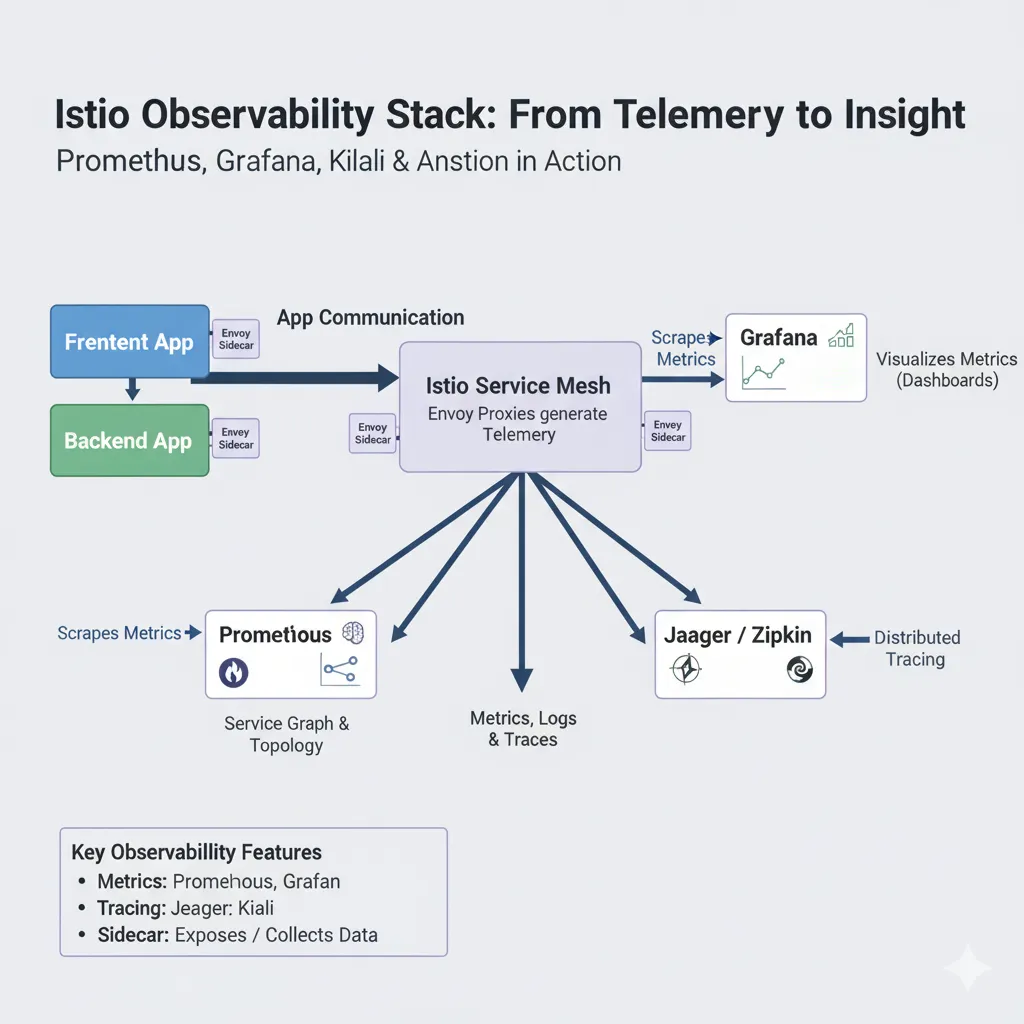
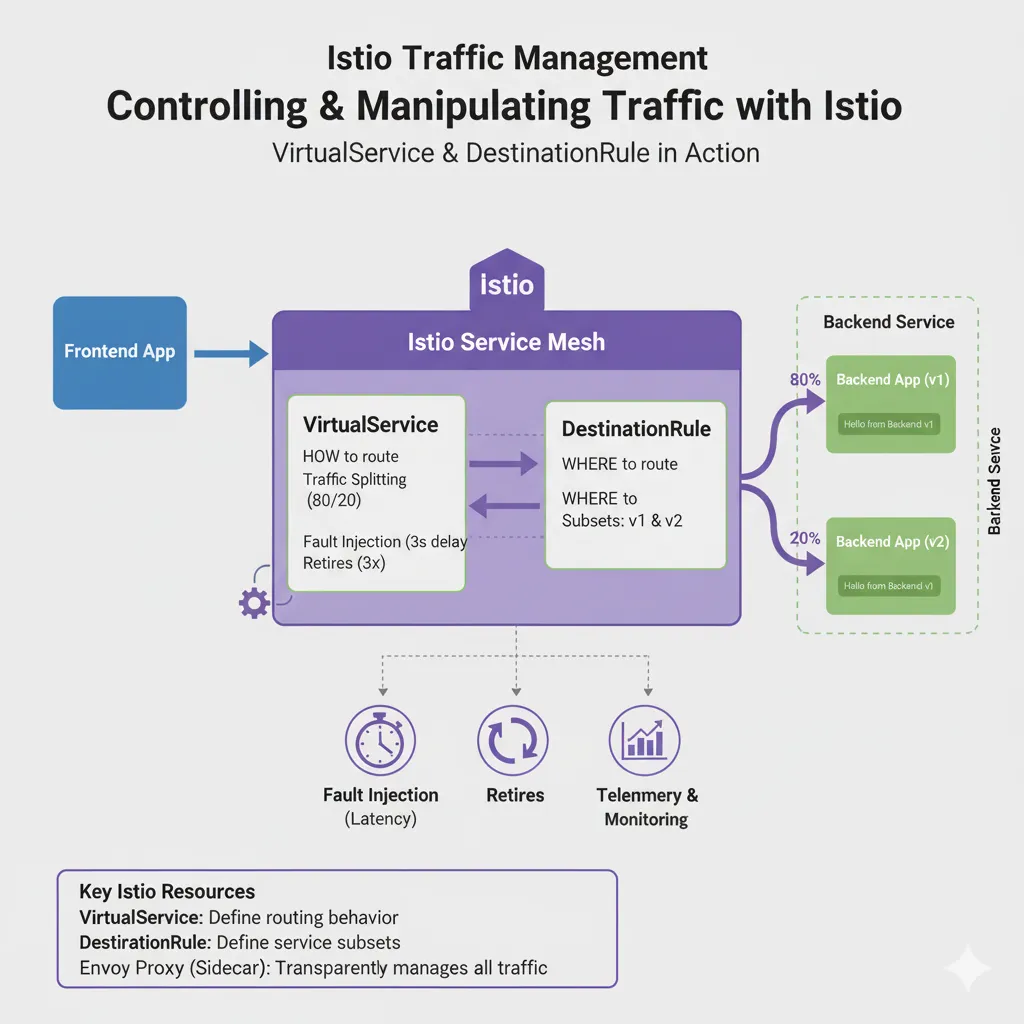
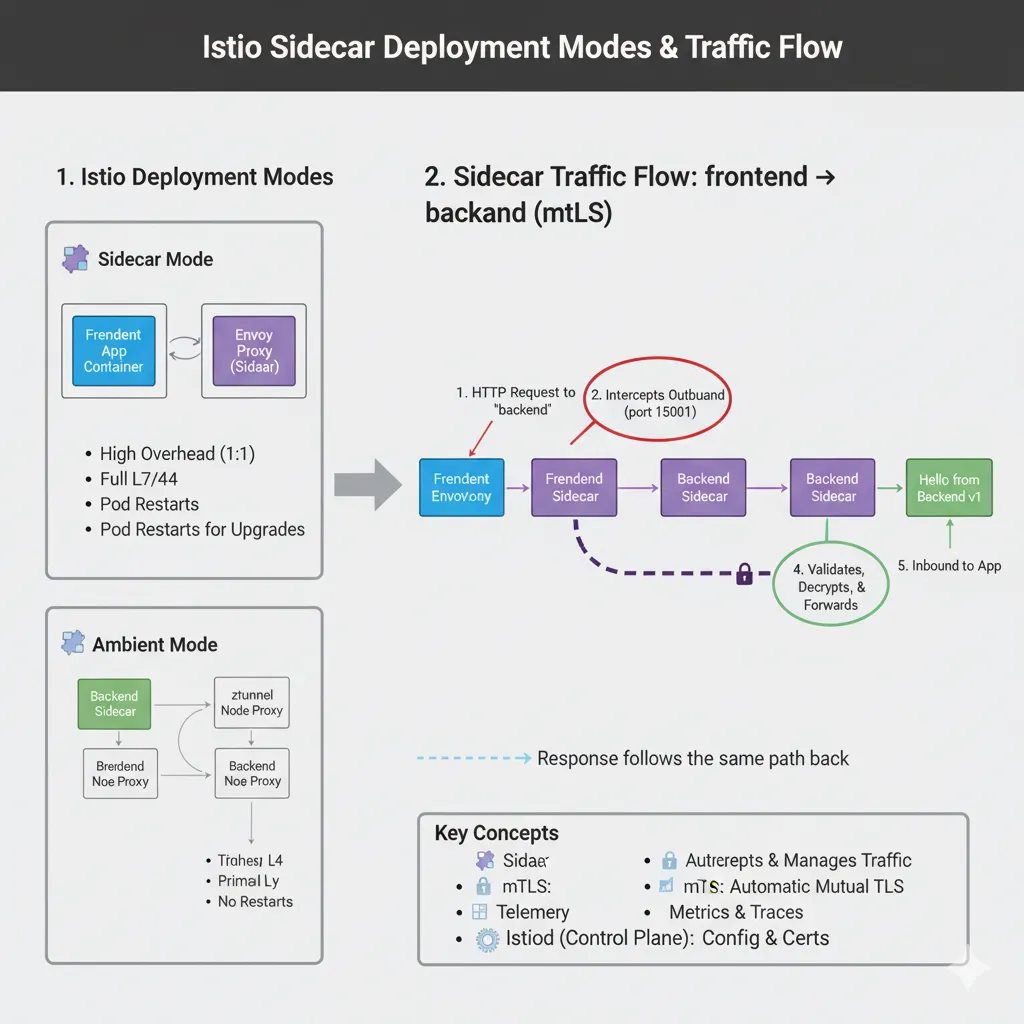
Building AI for Observability with AWS Bedrock

Building AI for Observability with AWS Bedrock

Building AI for Observability with AWS Bedrock In my previous post, I wrote about closing the last mile of observability with AI . The core idea was simple: we already have plenty of metrics, logs, and traces, but the real challenge is turning them into insights and answers that engineers can act on. In that post, I highlighted two main gaps: Connector layer – bridging multiple observability tools like Prometheus, Thanos, Elastic, etc. Insight layer – going beyond raw queries to provide real context and recommendations. Now, I’ve been experimenting with AWS Bedrock , and it feels like a natural way to solve both layers. ...

September 4, 2025 · 2 min · Vignesh Ragupathy

Closing the Last Mile of Observability with AI

Over the years, observability has grown in ways I couldn’t have imagined when I first started working in this space. Thanks to OpenTelemetry, we now have a standard way to collect traces, metrics, and logs. Tools like Grafana, Prometheus, Jaeger and Elasticsearch make it easy to store and visualize that data. But here’s the truth I keep coming back to: Even with all the dashboards and alerts, something is still missing. ...

September 1, 2025 · 4 min · Vignesh Ragupathy

Kubernetes monitoring in Zabbix via Prometheus backend

Summary Monitoring in Kubernetes is a complex task. The traditional monitoring framework is not sufficient to handle such a massive workload. Zabbix since version 6.0 provides a native way of integration for monitoring Kubernetes cluster. Zabbix-Kubernetes integration provides various templates to monitor kubernetes components like kube-controller-manager, kube-apiserver, kube-scheduler, kubelet, etc. It also supports automatic discovery of kubernetes nodes, pods and also collects metrics agentlessly. Why I don’t like the Zabbix’s direct way of monitoring Kubernetes cluster? Although Zabbix-Kubernetes integration looks promising in the beginning , it is not easy to use. ...

July 1, 2022 · 3 min · Vignesh Ragupathy

Plotly4Nagios - A Graph plugin for nagios monitoring

Plotly4Nagios is a nagios plugin to display the performance data in Graph. It uses the RRD database provided by pnp4nagios and visualize it in interactive graph format using plotly javascript. The first pre-release is published today in github and here is the installation document. You can experiment it and report the issue/feedback for further enhancement. Plotly4Nagios is accepted and listed under official nagios addons GIT badges Features Easy integration with nagios notes_url. Single page view for all performance metrics. Easy template change using configuration variable. Docker container based deploy and run. Prerequisite pnp4nagios Installation Download plotly4nagios.tar.gz and extract it under /usr/local/plotly4nagios Modify the config.json variables according to the environment Copy the plotly4nagios/plotly4nagios.conf to /etc/http/conf.d/ folder and restart httpd Add the follwing with notes_url to templates.cfg. notes_url /plotly4nagios/plotly4nagios.html?host=\$HOSTNAME\$&srv=_HOST_ notes_url /plotly4nagios/plotly4nagios.html?host=\$HOSTNAME$&srv=\$SERVICEDESC$ Restart httpd and nagios. Installation with docker(Ubuntu image) Build the docker image using the below command git clone https://github.com/vigneshragupathy/plotly4nagios.git cd plotly4nagios docker build -t plotly4nagios . Run the docker container using the below command docker run -it --name plotly4nagios -p 80:80 plotly4nagios Alternatively direct pull and run from docker hub. ...

March 24, 2021 · 2 min · Vignesh Ragupathy