Plotly4Nagios is a nagios plugin to display the performance data in Graph. It uses the RRD database provided by pnp4nagios and visualize it in interactive graph format using plotly javascript. The first pre-release is published today in github and here is the installation document. You can experiment it and report the issue/feedback for further enhancement.
Plotly4Nagios is accepted and listed under official nagios addons
GIT badges


Features
- Easy integration with nagios
notes_url. - Single page view for all performance metrics.
- Easy template change using configuration variable.
- Docker container based deploy and run.
Prerequisite
Installation
- Download plotly4nagios.tar.gz and extract it under /usr/local/plotly4nagios
- Modify the config.json variables according to the environment
- Copy the plotly4nagios/plotly4nagios.conf to /etc/http/conf.d/ folder and restart httpd
- Add the follwing with notes_url to templates.cfg.
    notes_url /plotly4nagios/plotly4nagios.html?host=\$HOSTNAME\$&srv=_HOST_
    notes_url /plotly4nagios/plotly4nagios.html?host=\$HOSTNAME$&srv=\$SERVICEDESC$
- Restart httpd and nagios.
Installation with docker(Ubuntu image)
- Build the docker image using the below command
git clone https://github.com/vigneshragupathy/plotly4nagios.git
cd plotly4nagios
docker build -t plotly4nagios .
- Run the docker container using the below command
docker run -it --name plotly4nagios -p 80:80 plotly4nagios
Alternatively direct pull and run from docker hub.
docker run -d -p 80:80 --name plotly4nagios vigneshragupathy/plotly4nagios
Open from the browser and view the application at http://localhost/nagios
Login details
- Username : nagiosadmin
- Password : nagios
Demo
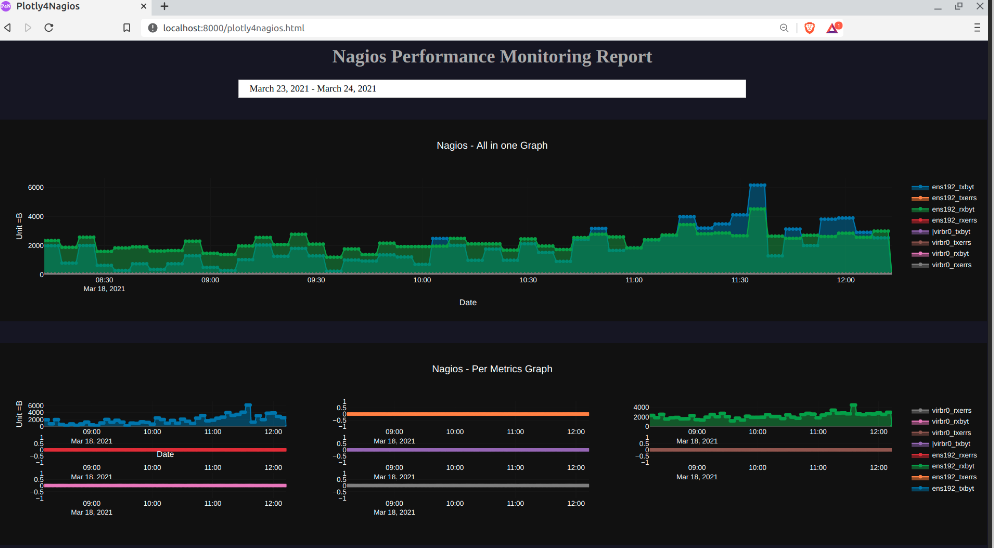
Screenshot
Dark mode
License
Copyright 2020-2021 © Vignesh Ragupathy. All rights reserved.
Licensed under the MIT License
Comments