⬅ Back to Intro | Next → Part 7 - Security with mTLS and AuthorizationPolicies
💡 This post is part of my Istio Hands-on Series — a practical journey into Kubernetes Service Mesh. Each post builds on the previous one with hands-on labs, real command outputs, and clear explanations aimed at learning Istio by doing, not just reading.
Objective:
In this post, you’ll learn how to set up distributed tracing in Istio using Jaeger.
- Enable tracing in Istio
- Visualize request flow between frontend and backend
- Understand how trace IDs propagate across services
- Fix common tracing setup issues
Modern microservices can span dozens of services and network hops — knowing why a request is slow or where it failed can be tricky. That’s where distributed tracing comes in — and Istio makes it seamless using Jaeger and Envoy sidecars.
Istio’s Envoy proxies (sidecars) can automatically collect and propagate traces across services, but only if the incoming request contains trace headers (like x-b3-traceid, x-b3-spanid, etc.).
In our setup:
The frontend (curlimages/curl) just runs curl — it doesn’t send tracing headers.
The backend (hashicorp/http-echo) is a static server — it doesn’t add tracing info.
So the Envoy proxies see plain HTTP traffic, but no distributed trace context → nothing appears in Jaeger.
What We’ll Do
To visualize how tracing works, we’ll:
- Replace the simple containers with trace-enabled apps (using
curl+ headers). - Enable Envoy sampling and verify Istio’s tracing config.
- See trace spans in Jaeger showing both frontend and backend calls.
Step 1: Use Trace-Propagating Frontend
Let’s replace your simple frontend with one that explicitly sends trace headers — simulating a real app. Let’s assume you already have two simple microservices running in your mesh:
Frontend:
cat <<'EOF' | kubectl apply -f -
apiVersion: apps/v1
kind: Deployment
metadata:
  name: frontend
spec:
  replicas: 1
  selector:
    matchLabels:
      app: frontend
  template:
    metadata:
      labels:
        app: frontend
    spec:
      containers:
      - name: frontend
        image: curlimages/curl
        command: ["sh", "-c"]
        args:
          - |
            while true; do
              TRACE_ID=$(od -vAn -N8 -tx1 /dev/urandom | tr -d ' \n')
              PARENT_SPAN=$(od -vAn -N8 -tx1 /dev/urandom | tr -d ' \n')
              curl -s http://backend \
                -H "x-b3-traceid: $TRACE_ID" \
                -H "x-b3-spanid: $PARENT_SPAN" \
                -H "x-b3-sampled: 1"
              sleep 5
            done
        ports:
        - containerPort: 80
---
apiVersion: v1
kind: Service
metadata:
  name: frontend
spec:
  selector:
    app: frontend
  ports:
  - port: 80
    targetPort: 80
EOF
This simulates a tracing-aware application that injects B3 headers in each request.
Step 2: Keep the Backend as-is
Your backend (hashicorp/http-echo) is perfect for this demo — it simply echoes responses.
Envoy at the backend side will automatically capture spans once it sees the tracing headers.
Step 3: Enable Tracing in Istio
By default, some demo profiles don’t fully enable tracing — so we’ll explicitly enable it with Jaeger as the backend.
Create a config file istio-jaeger-tracing.yaml:
apiVersion: install.istio.io/v1alpha1
kind: IstioOperator
spec:
  profile: demo
  meshConfig:
    enableTracing: true
    defaultConfig:
      tracing:
        sampling: 100
        zipkin:
          address: jaeger-collector.istio-system.svc.cluster.local:9411
    accessLogFile: /dev/stdout
    accessLogEncoding: TEXT
    accessLogFormat: '[%START_TIME%] "%REQ(:METHOD)% %REQ(X-ENVOY-ORIGINAL-PATH?:PATH)% %PROTOCOL%" %RESPONSE_CODE% traceID=%REQ(X-B3-TRACEID)% spanID=%REQ(X-B3-SPANID)% service=%DOWNSTREAM_LOCAL_ADDRESS%'
Apply it:
istioctl install -f istio-jaeger-tracing.yaml -y
This ensures:
- Tracing is enabled globally
- Sampling is 100% (trace every request)
- Traces are exported to Jaeger (port 9411)
Step 4: Restart the Applications
For sidecars to load the new tracing config:
kubectl rollout restart deploy frontend backend
Step 5: Generate Some Traffic
Let’s generate a continuous stream of requests:
kubectl exec deploy/frontend -- sh -c 'while true; do curl -s http://backend > /dev/null; sleep 2; done'
Step 6: Verify Tracing in Logs
You can see trace IDs in Envoy’s access logs too:
kubectl logs -l app=frontend -c istio-proxy | grep traceID
Example output:
[2025-11-11T10:31:23.108Z] "GET / HTTP/1.1" 200 traceID=- spanID=- service=10.96.245.140:80
[2025-11-11T10:31:24.746Z] "GET / HTTP/1.1" 200 traceID=e28cfcca4e031099 spanID=07d23de702980446 service=10.96.245.140:80
[2025-11-11T10:31:29.766Z] "GET / HTTP/1.1" 200 traceID=f8fd657e618fd308 spanID=9e389a992ffe0207 service=10.96.245.140:80
[2025-11-11T10:31:34.783Z] "GET / HTTP/1.1" 200 traceID=340e3a3dbe1aadc3 spanID=7185231baf56ef9b service=10.96.245.140:80
[2025-11-11T10:31:39.805Z] "GET / HTTP/1.1" 200 traceID=127182d353ae19f8 spanID=c43f75f2ca957569 service=10.96.245.140:80
[2025-11-11T10:31:44.828Z] "GET / HTTP/1.1" 200 traceID=c682fbdfd41c0553 spanID=1e0f0891b5fc7b63 service=10.96.245.140:80
[2025-11-11T10:31:49.845Z] "GET / HTTP/1.1" 200 traceID=8e4207db299688bd spanID=14721784089a0c9f service=10.96.245.140:80
[2025-11-11T10:31:54.862Z] "GET / HTTP/1.1" 200 traceID=714450cb4972f4da spanID=efcc9f9bdd2170b7 service=10.96.245.140:80
[2025-11-11T10:31:59.880Z] "GET / HTTP/1.1" 200 traceID=d931a777f2c8d035 spanID=c39eff4a035ddadc service=10.96.245.140:80
[2025-11-11T10:32:04.901Z] "GET / HTTP/1.1" 200 traceID=0d30f976a64daaeb spanID=fa05b2dd92cf520d service=10.96.245.140:80
This confirms Envoy is generating trace metadata and exporting spans.
Step 7: View Traces in Jaeger
Forward Jaeger’s UI port:
kubectl port-forward svc/jaeger-collector -n istio-system 16686:16686
Now open:
Search for services like:
frontend.default
backend.default
Screenshot:
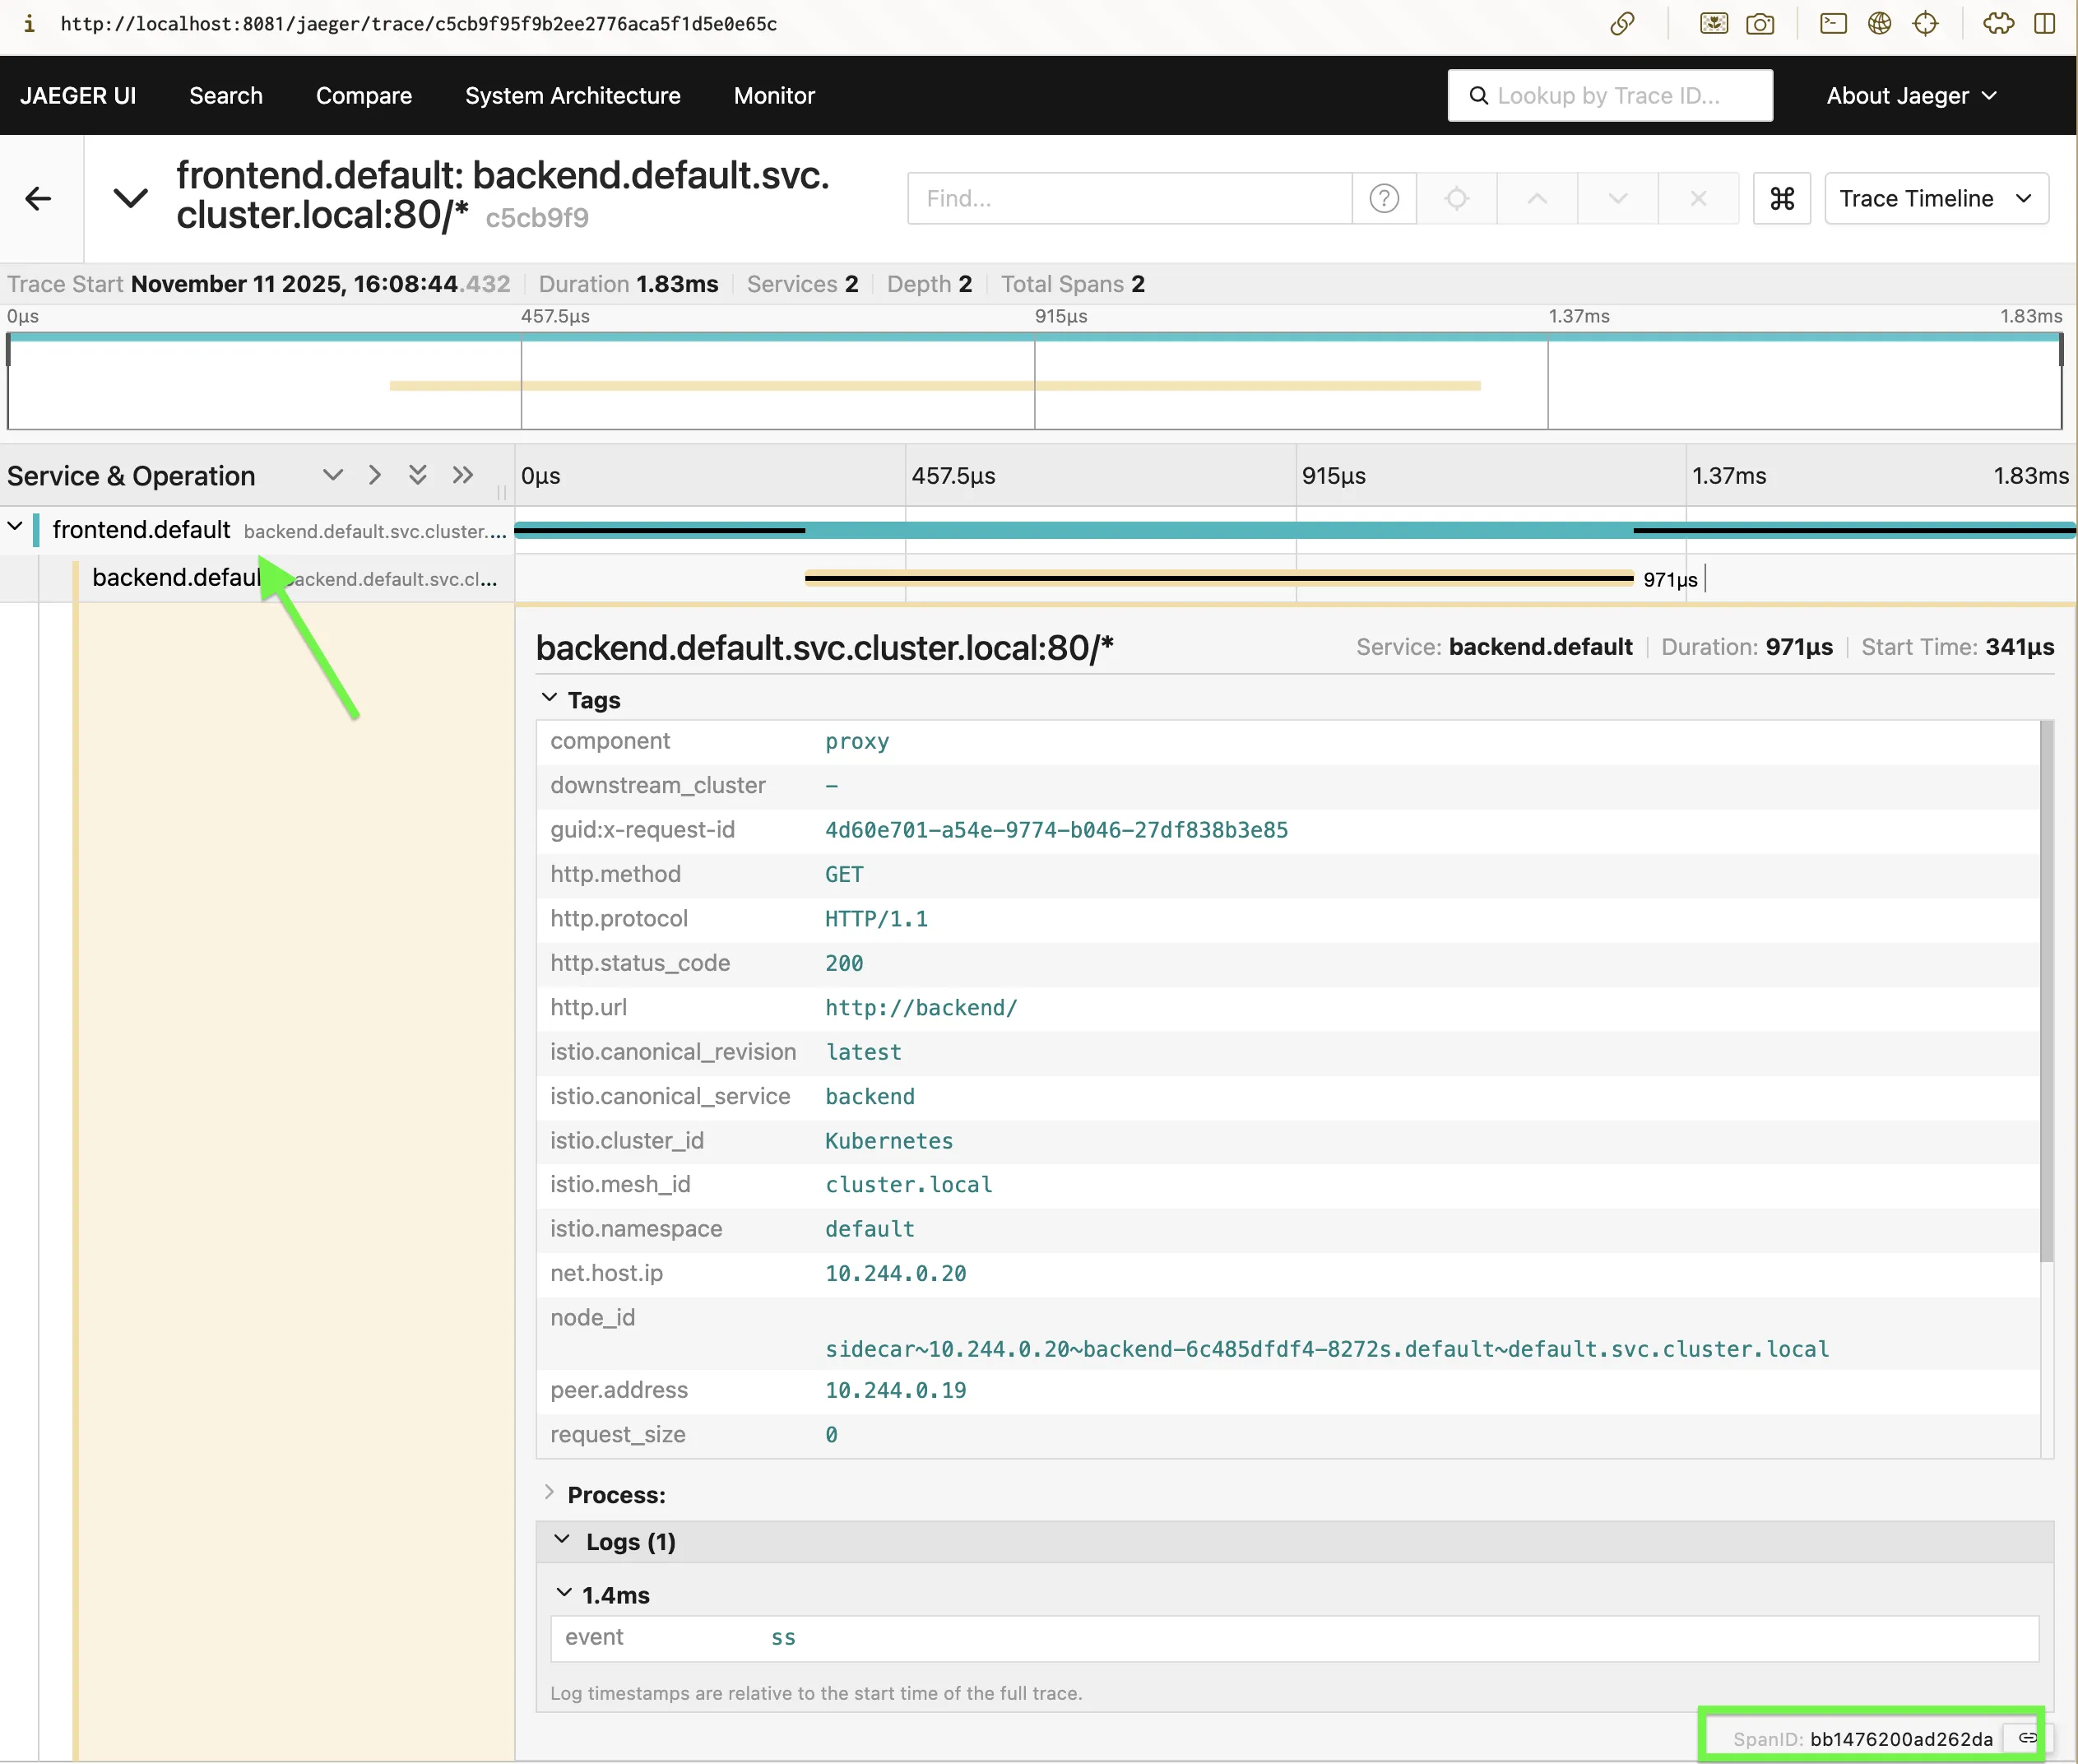
You’ll start seeing trace timelines showing request latency, hops, and mTLS propagation.
How It Works
When frontend calls backend:
- The frontend Envoy generates a new
traceIDandspanID. - The call is sent via mTLS to the backend Envoy .
- The backend Envoy creates a child span and propagates trace context headers.
- Both Envoys asynchronously send their spans to Jaeger Collector on port
9411. - Jaeger stitches them together to form a full distributed trace.
Key Takeaways
| Concept | Description |
|---|---|
| Trace ID | Uniquely identifies a request across services |
| Span ID | Represents one segment of a trace |
| Jaeger Collector | Receives spans from Envoy |
| Sampling | Controls how often traces are collected |
| mTLS + Tracing | Gives secure + observable service mesh traffic |
Wrapping Up
You’ve now set up distributed tracing in Istio — where every hop, latency, and dependency is automatically captured and visualized in Jaeger.
✅ You can now:
- Trace requests end-to-end
- Debug slow or failing services visually
- Build observability dashboards that combine metrics + logs + traces
This forms the final pillar of Istio observability — bringing full visibility into your mesh.
🧵 Next Up
👉 Istio Hands-on Part 6 – Security with mTLS and AuthorizationPolicies
We’ll explore Istio’s zero-trust security model and enforce service-to-service authentication.
⬅ Back to Intro | Next → Part 7 - Security with mTLS and AuthorizationPolicies
Comments