⬅ Back to Intro | Next → Part 6 - Security with mTLS and AuthorizationPolicies
💡 This post is part of my Istio Hands-on Series — a practical journey into Kubernetes Service Mesh. Each post builds on the previous one with hands-on labs, real command outputs, and clear explanations aimed at learning Istio by doing, not just reading.
Objective
In this post, you’ll set up and explore Istio’s observability stack — powered by:
- 🧠 Prometheus → collects metrics
- 📈 Grafana → visualizes metrics
- 🕸️ Kiali → service graph & topology view
- 🧭 Jaeger / Zipkin → distributed tracing
By the end, you’ll have a live dashboard showing how your frontend and backend communicate inside the mesh.
Step 1: Install Istio Addons
Istio provides sample manifests for its observability tools. Install them all with one command:
kubectl apply -f https://raw.githubusercontent.com/istio/istio/release-1.27/samples/addons/prometheus.yaml
kubectl apply -f https://raw.githubusercontent.com/istio/istio/release-1.27/samples/addons/grafana.yaml
kubectl apply -f https://raw.githubusercontent.com/istio/istio/release-1.27/samples/addons/kiali.yaml
kubectl apply -f https://raw.githubusercontent.com/istio/istio/release-1.27/samples/addons/jaeger.yaml
Check the pods:
kubectl get pods -n istio-system
✅ You should see:
NAME                                    READY   STATUS    RESTARTS      AGE
grafana-cdb9db549-45llc                 1/1     Running   0             102s
istio-egressgateway-5b6b664d8-s7728     1/1     Running   1 (48m ago)   24h
istio-ingressgateway-7d7f977654-spgkh   1/1     Running   1 (48m ago)   24h
istiod-86db895df-j68p4                  1/1     Running   1 (48m ago)   24h
jaeger-84b9c75d5f-s2pw6                 1/1     Running   0             100s
kiali-56f54f58f9-x7h44                  1/1     Running   0             101s
prometheus-7bf56b6bc-k6gxw              2/2     Running   0             103s
Step 2: Verify Metrics Collection (Prometheus)
Port-forward the Prometheus service:
kubectl port-forward svc/prometheus -n istio-system 9090:9090
Search for these metrics:
istio_requests_total– total requests through the meshistio_request_duration_seconds– request latencyistio_tcp_sent_bytes_total– TCP traffic
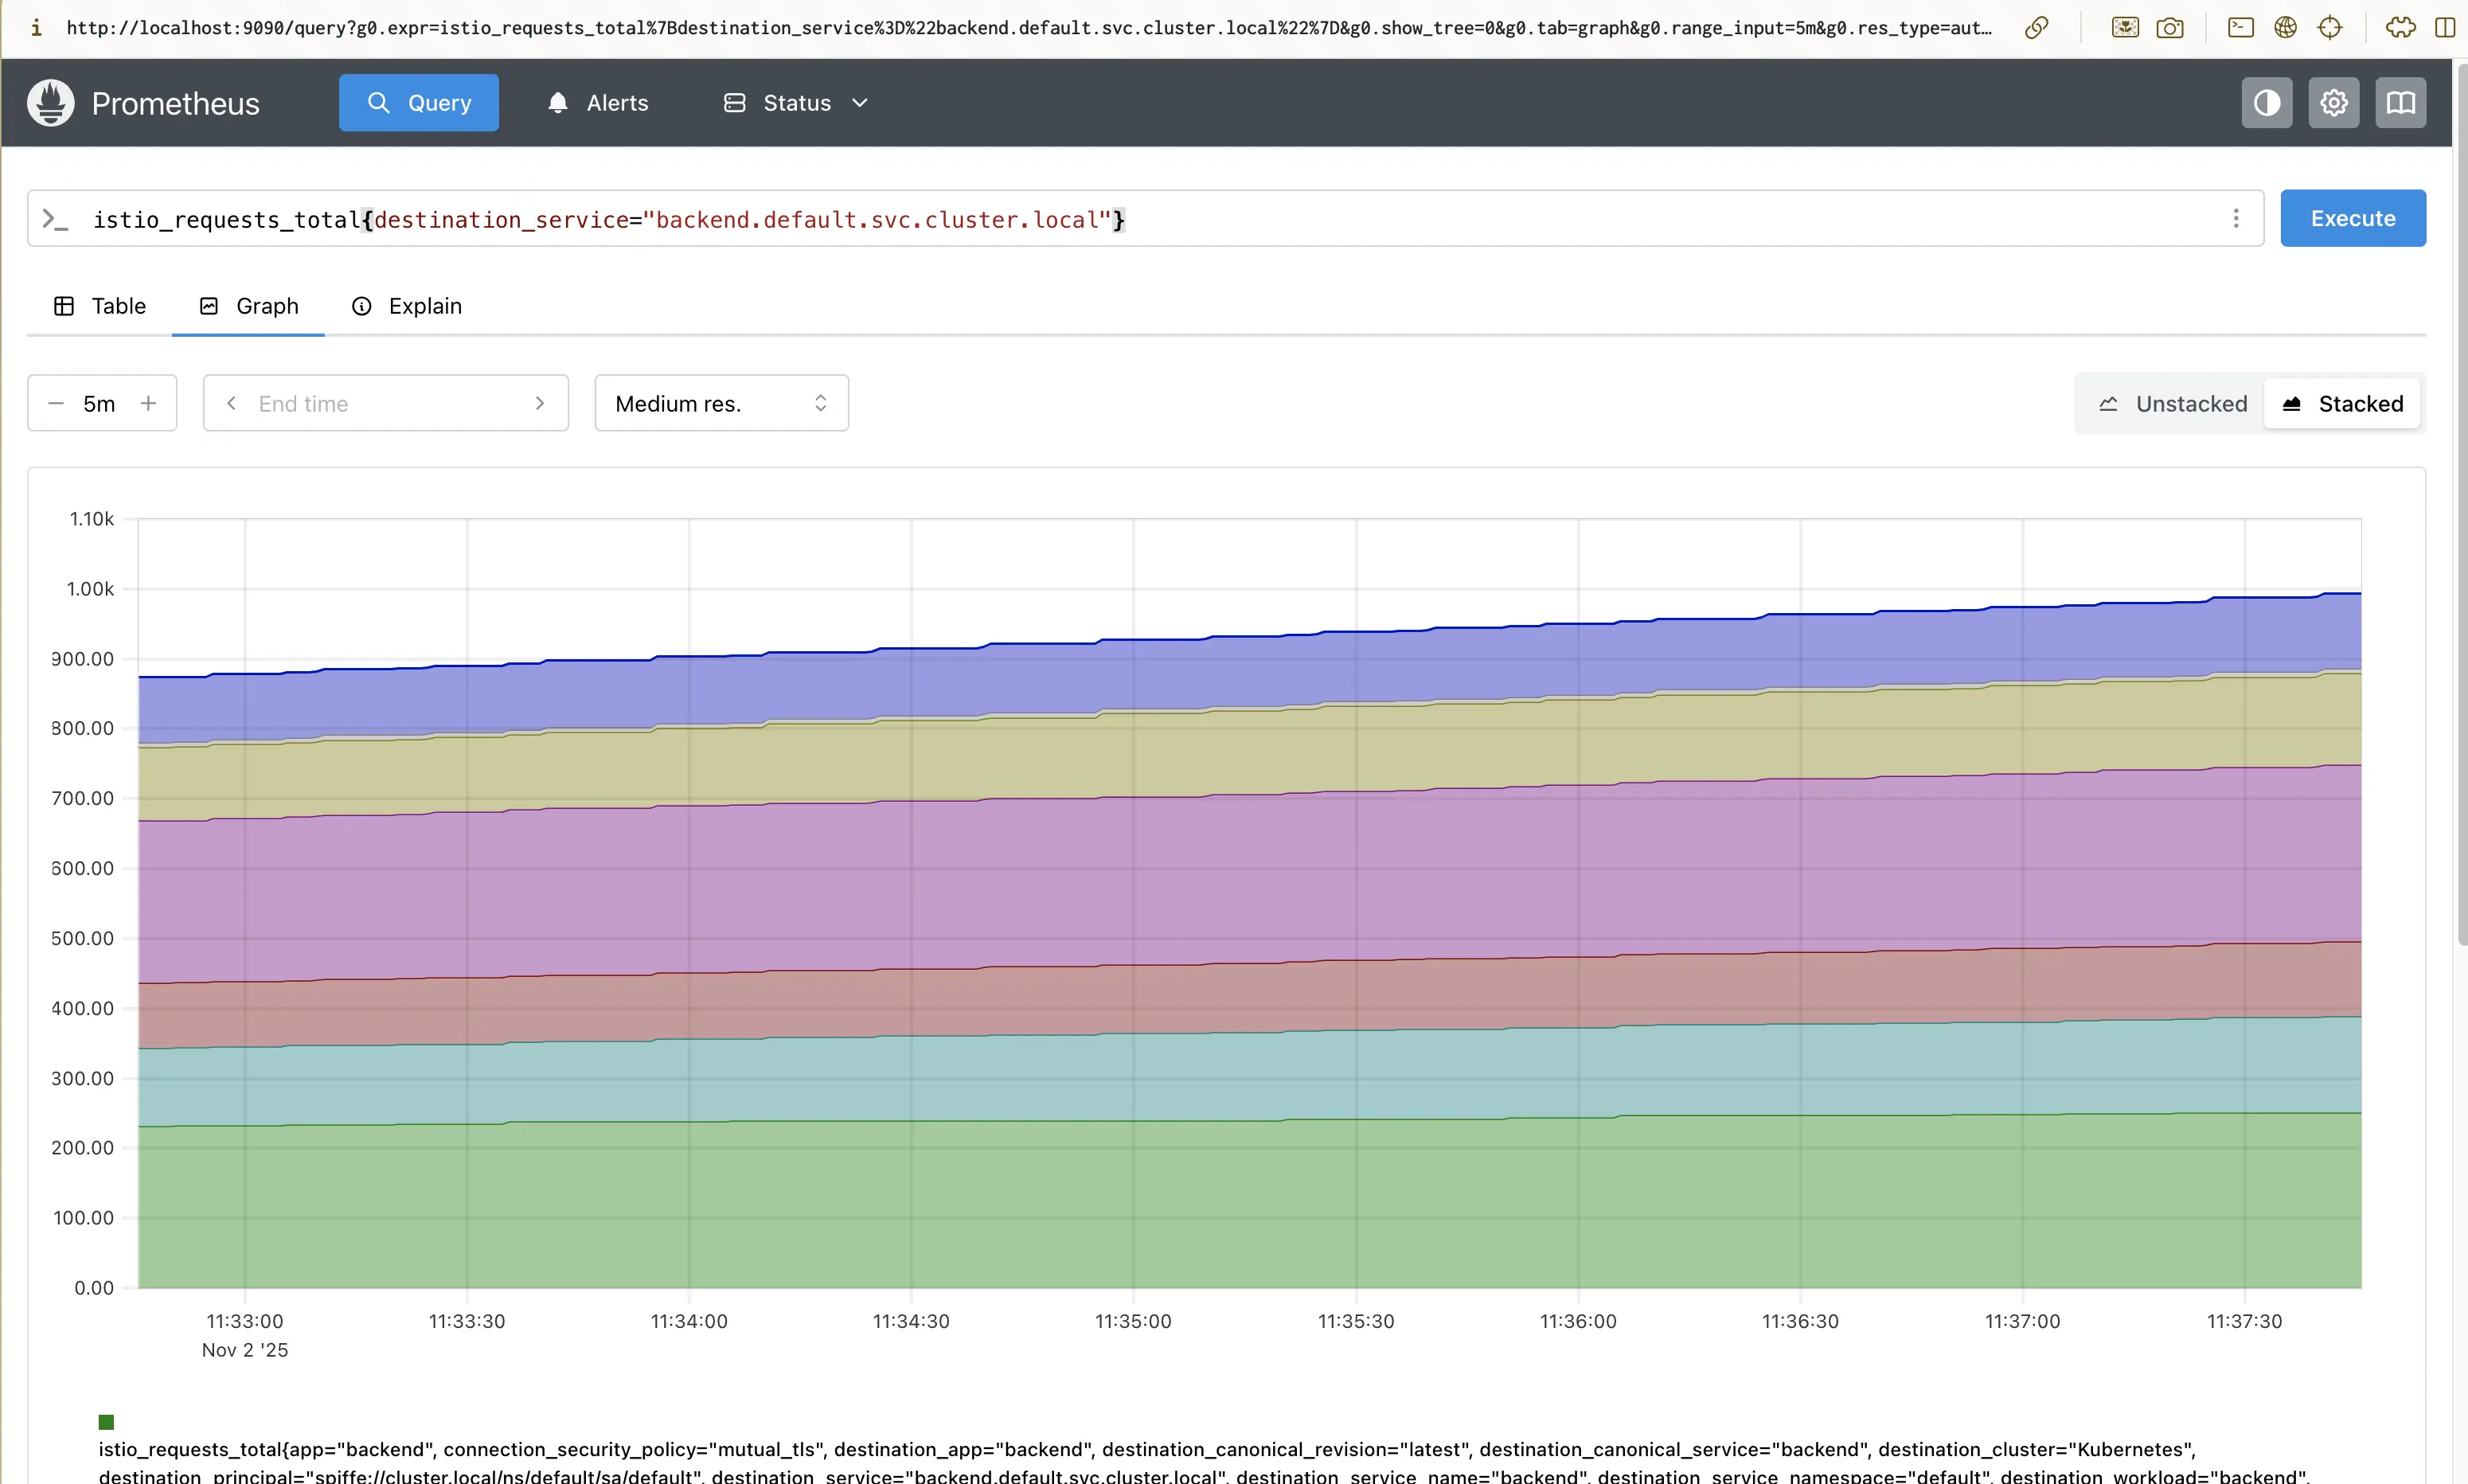
Try querying:
istio_requests_total{destination_service="backend.default.svc.cluster.local"}
✅ You’ll see metrics showing requests from frontend → backend.
Screenshot:
Step 3: Visualize Metrics in Grafana
Port-forward Grafana:
kubectl port-forward svc/grafana -n istio-system 3000:3000
(default credentials: admin / admin )
You’ll see built-in dashboards such as:
- Istio Mesh Dashboard
- Istio Service Dashboard
- Istio Workload Dashboard
Explore the following:
- Requests per second (RPS)
- Success rate
- Latency percentiles (P50, P90, P99)
- Resource utilization per proxy
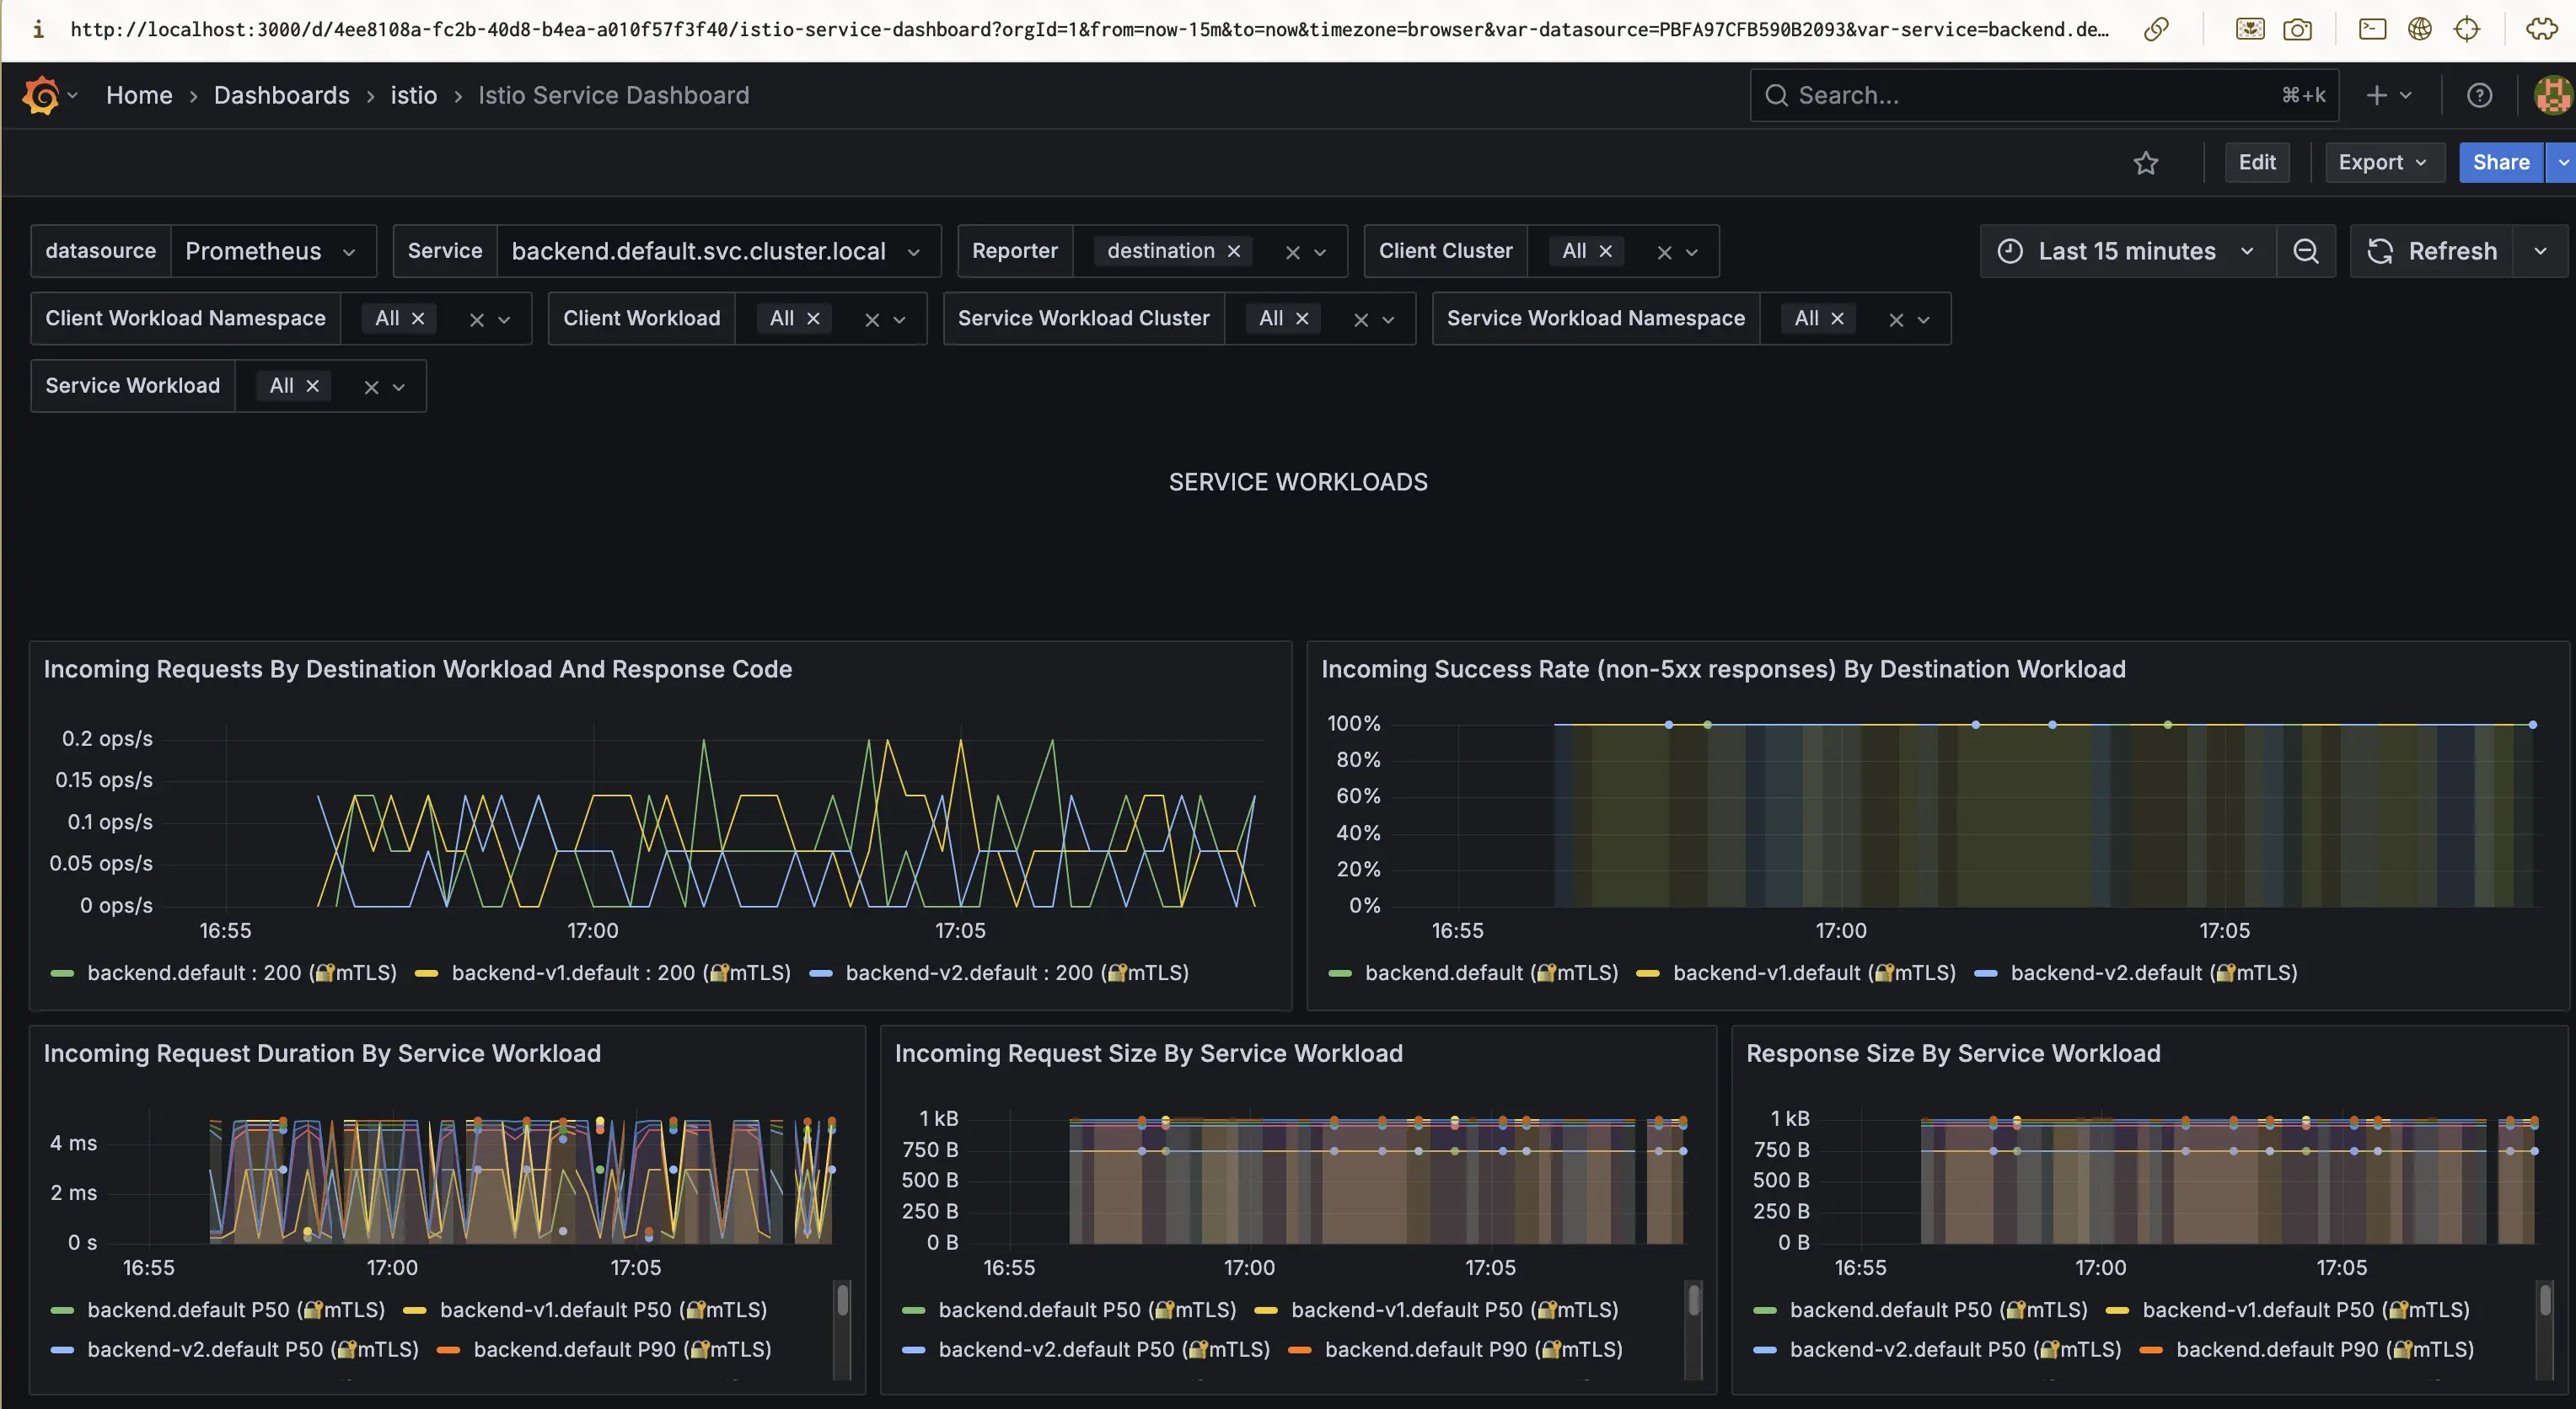
💡 Tip: The “Istio Service Dashboard” is great for verifying canary deployments (you’ll see separate lines for
v1andv2).
Screenshot:
Step 4: Explore Service Graph with Kiali
Port-forward the Kiali service:
kubectl port-forward svc/kiali -n istio-system 20001:20001
Login (default: admin / admin)
In the left menu → Graph → Namespace: default
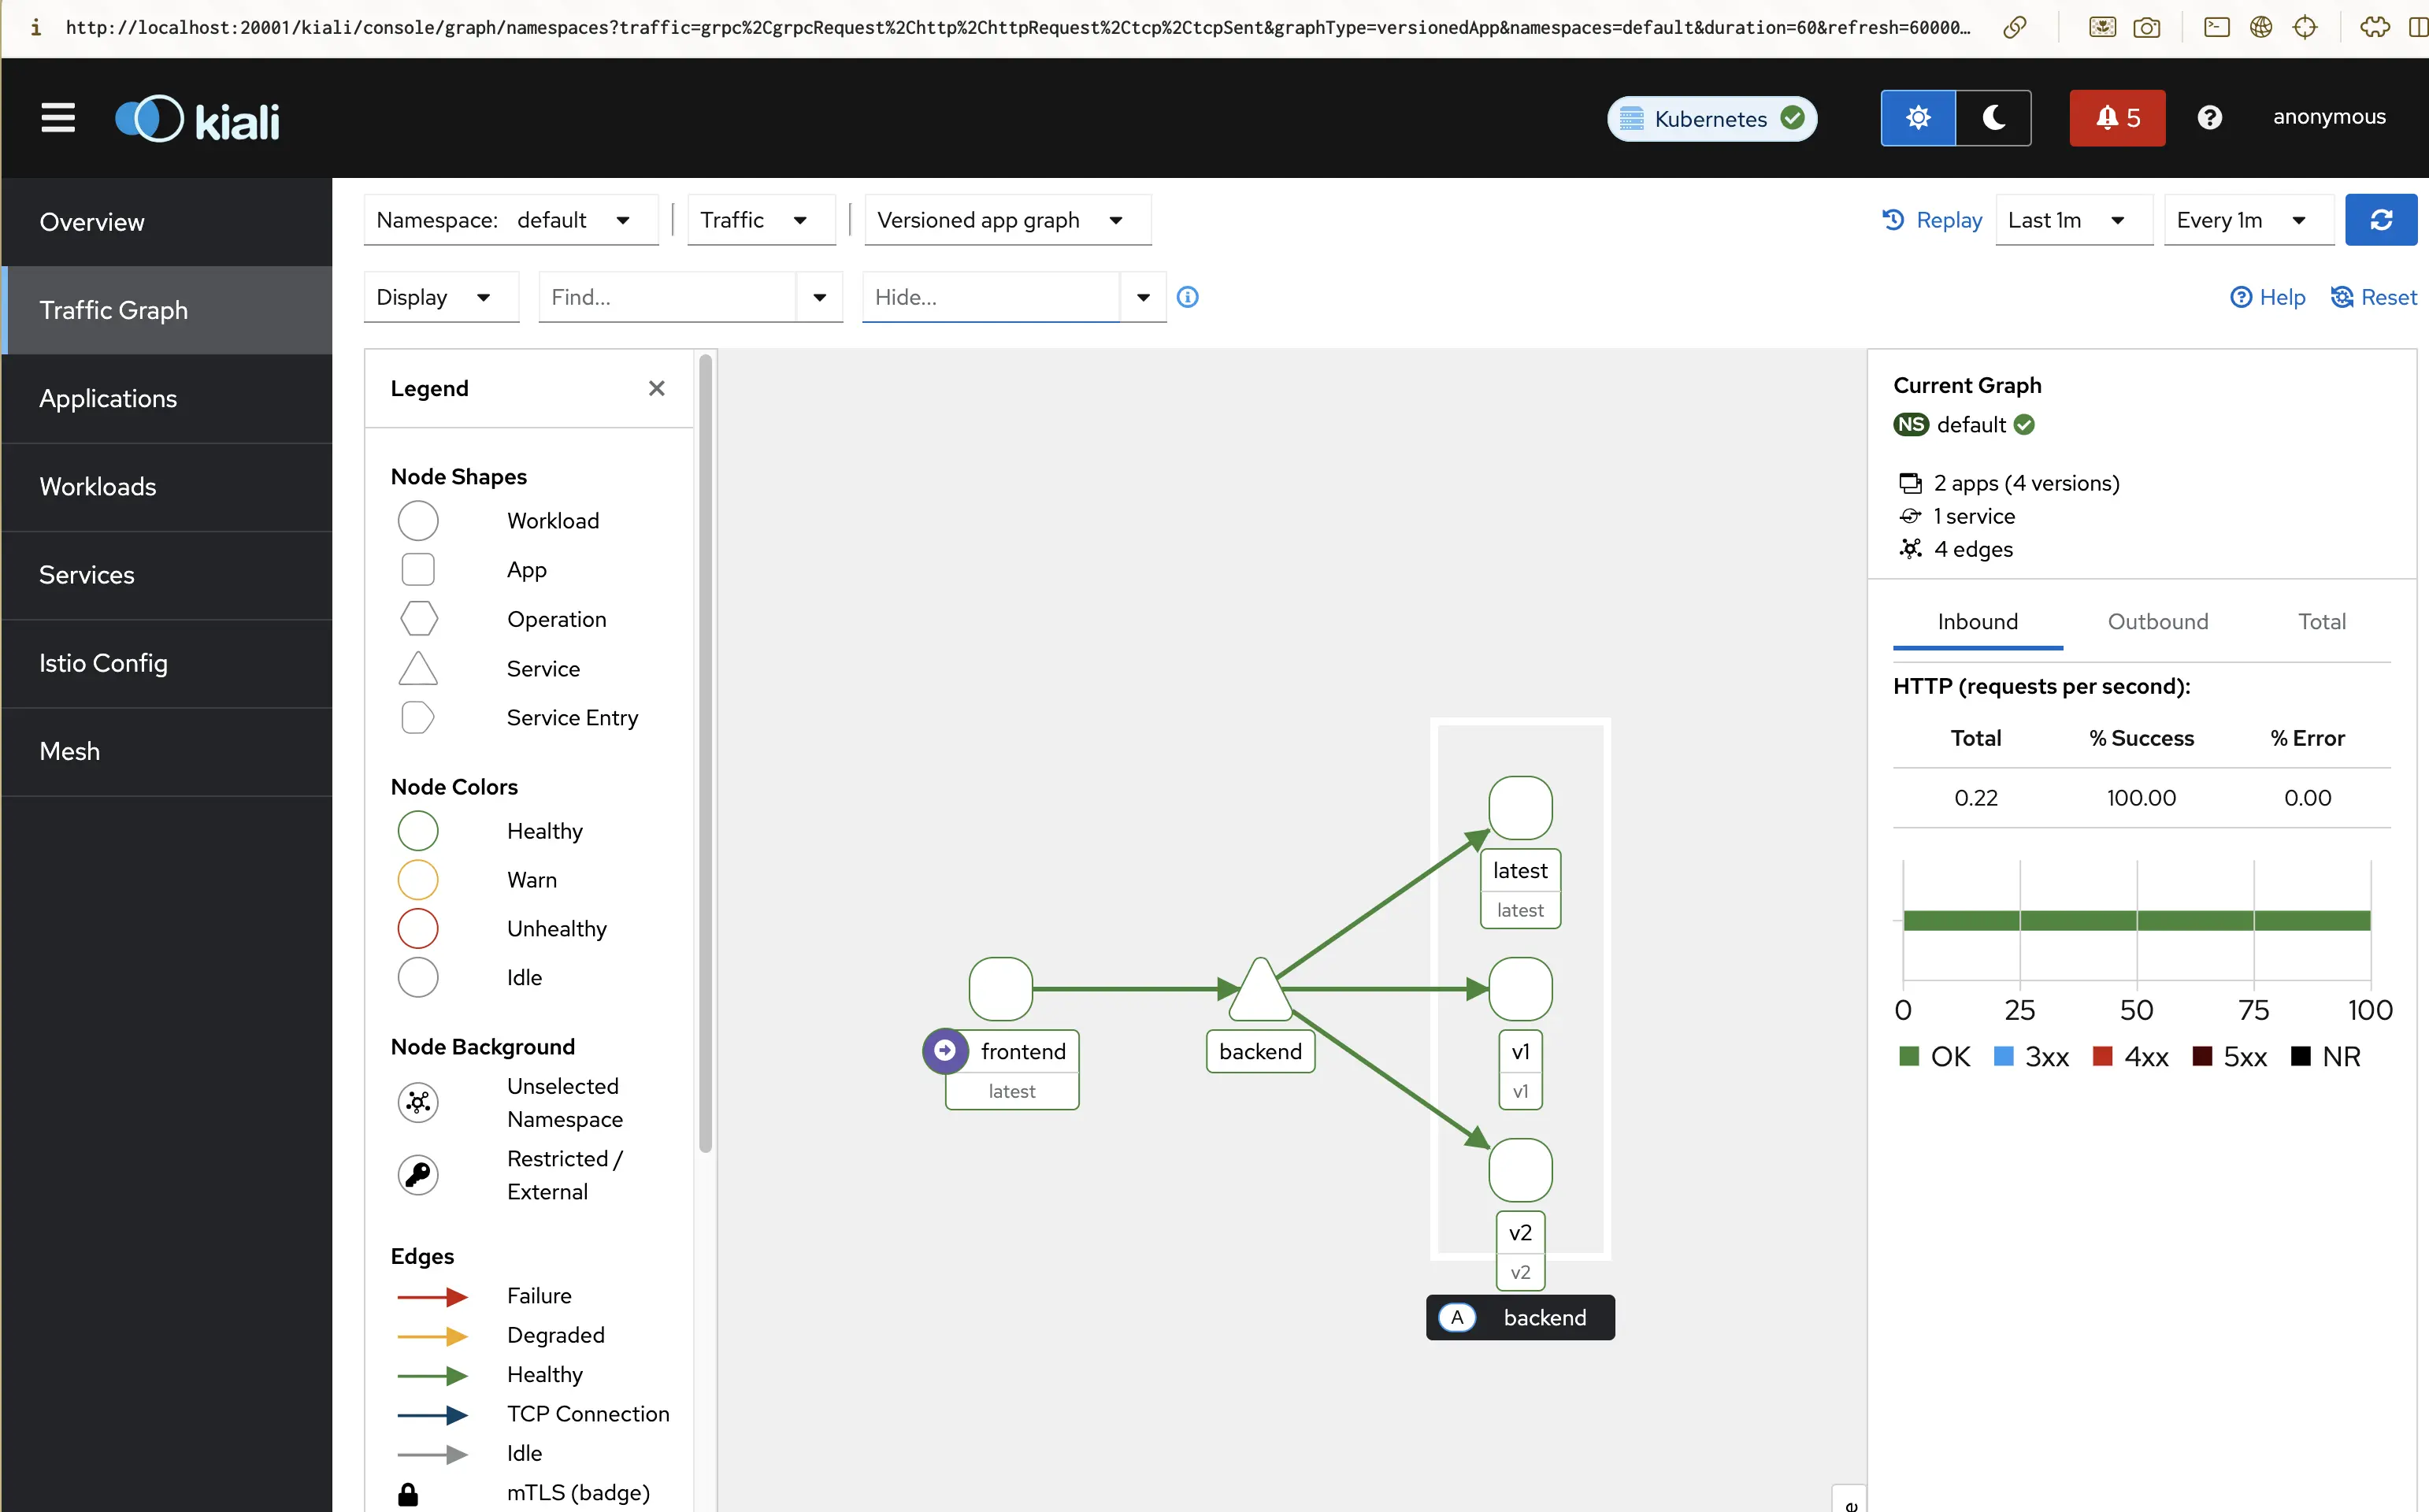
✅ You’ll see a live topology like:
frontend → backend
If you used traffic splitting (from Part 4), you’ll also see two backend versions (v1 and v2) with proportional traffic lines.
Screenshot:
💡 Kiali Tips
- Hover over edges to see request rate, error rate, and latency.
- Click nodes to see inbound/outbound metrics.
- Filter by
Request Type = HTTPorProtocol = TCP.
Kiali also lets you:
- View applied
VirtualServiceandDestinationRuleresources - Detect misconfigurations (warnings on graph edges)
- Explore namespace-level health
Step 5: Validate Metrics Endpoints (Optional)
Each Envoy proxy (sidecar) exposes its own Prometheus metrics on port 15020 .
Check metrics for a specific pod:
kubectl port-forward pod/backend-xxxxxx 15020:15020
Then open http://localhost:15020/stats/prometheus
You’ll see all metrics directly from the Envoy sidecar.
Step 6: Understanding the Observability Flow
Here’s how the pieces fit together:
[frontend ↔ backend]
     │
     ▼
[Envoy sidecars] → metrics → [Prometheus]
                           ↘ traces → [Jaeger]
                            ↘ dashboards → [Grafana]
                            ↘ topology → [Kiali]
| Component | Purpose |
|---|---|
| Envoy (sidecar) | Exposes metrics, logs, and traces |
| Prometheus | Collects metrics via scraping |
| Grafana | Visualizes Prometheus data |
| Kiali | Visual topology and Istio resource overview |
| Jaeger | Distributed tracing visualization |
Step 8: Clean Up (Optional)
To remove the observability components:
kubectl delete -f https://raw.githubusercontent.com/istio/istio/release-1.27/samples/addons/
This won’t affect your mesh — only removes dashboards.
Summary
In this post, you:
- Installed Istio’s observability addons (Prometheus, Grafana, Kiali, Jaeger)
- Verified metrics and traces in action
- Visualized real traffic in Kiali’s service graph
- Learned how Istio turns telemetry into insight
🧵 Next Up
👉 Istio Hands-on Part 6 – Distributed Tracing with Jaeger
We’ll explore Istio’s distributed tracing capabilities and how to visualize request flows.
⬅ Back to Intro | Next → Part 6 - Distributed Tracing with Jaeger
Comments