Outside of the terminal, I enjoy running, lifting weights, and spending time exploring gadgets and photography. This blog is where I share technical insights, hands-on guides, and the occasional detour into the things I enjoy outside the terminal.


Year 2025 Reflection Resumed writing blogs after a long gap of nearly 3 years. Completed a challenging trek at Gingee Fort with my wife and two kids, climbing both Rajagiri and Krishnagiri hills on the same day. My kids (aged 3 and 7) ran their first mini marathon. Completed my first 10-miler twice, once in Chennai and once in Bangalore. The Bangalore run, done in the rain, was something special. ...

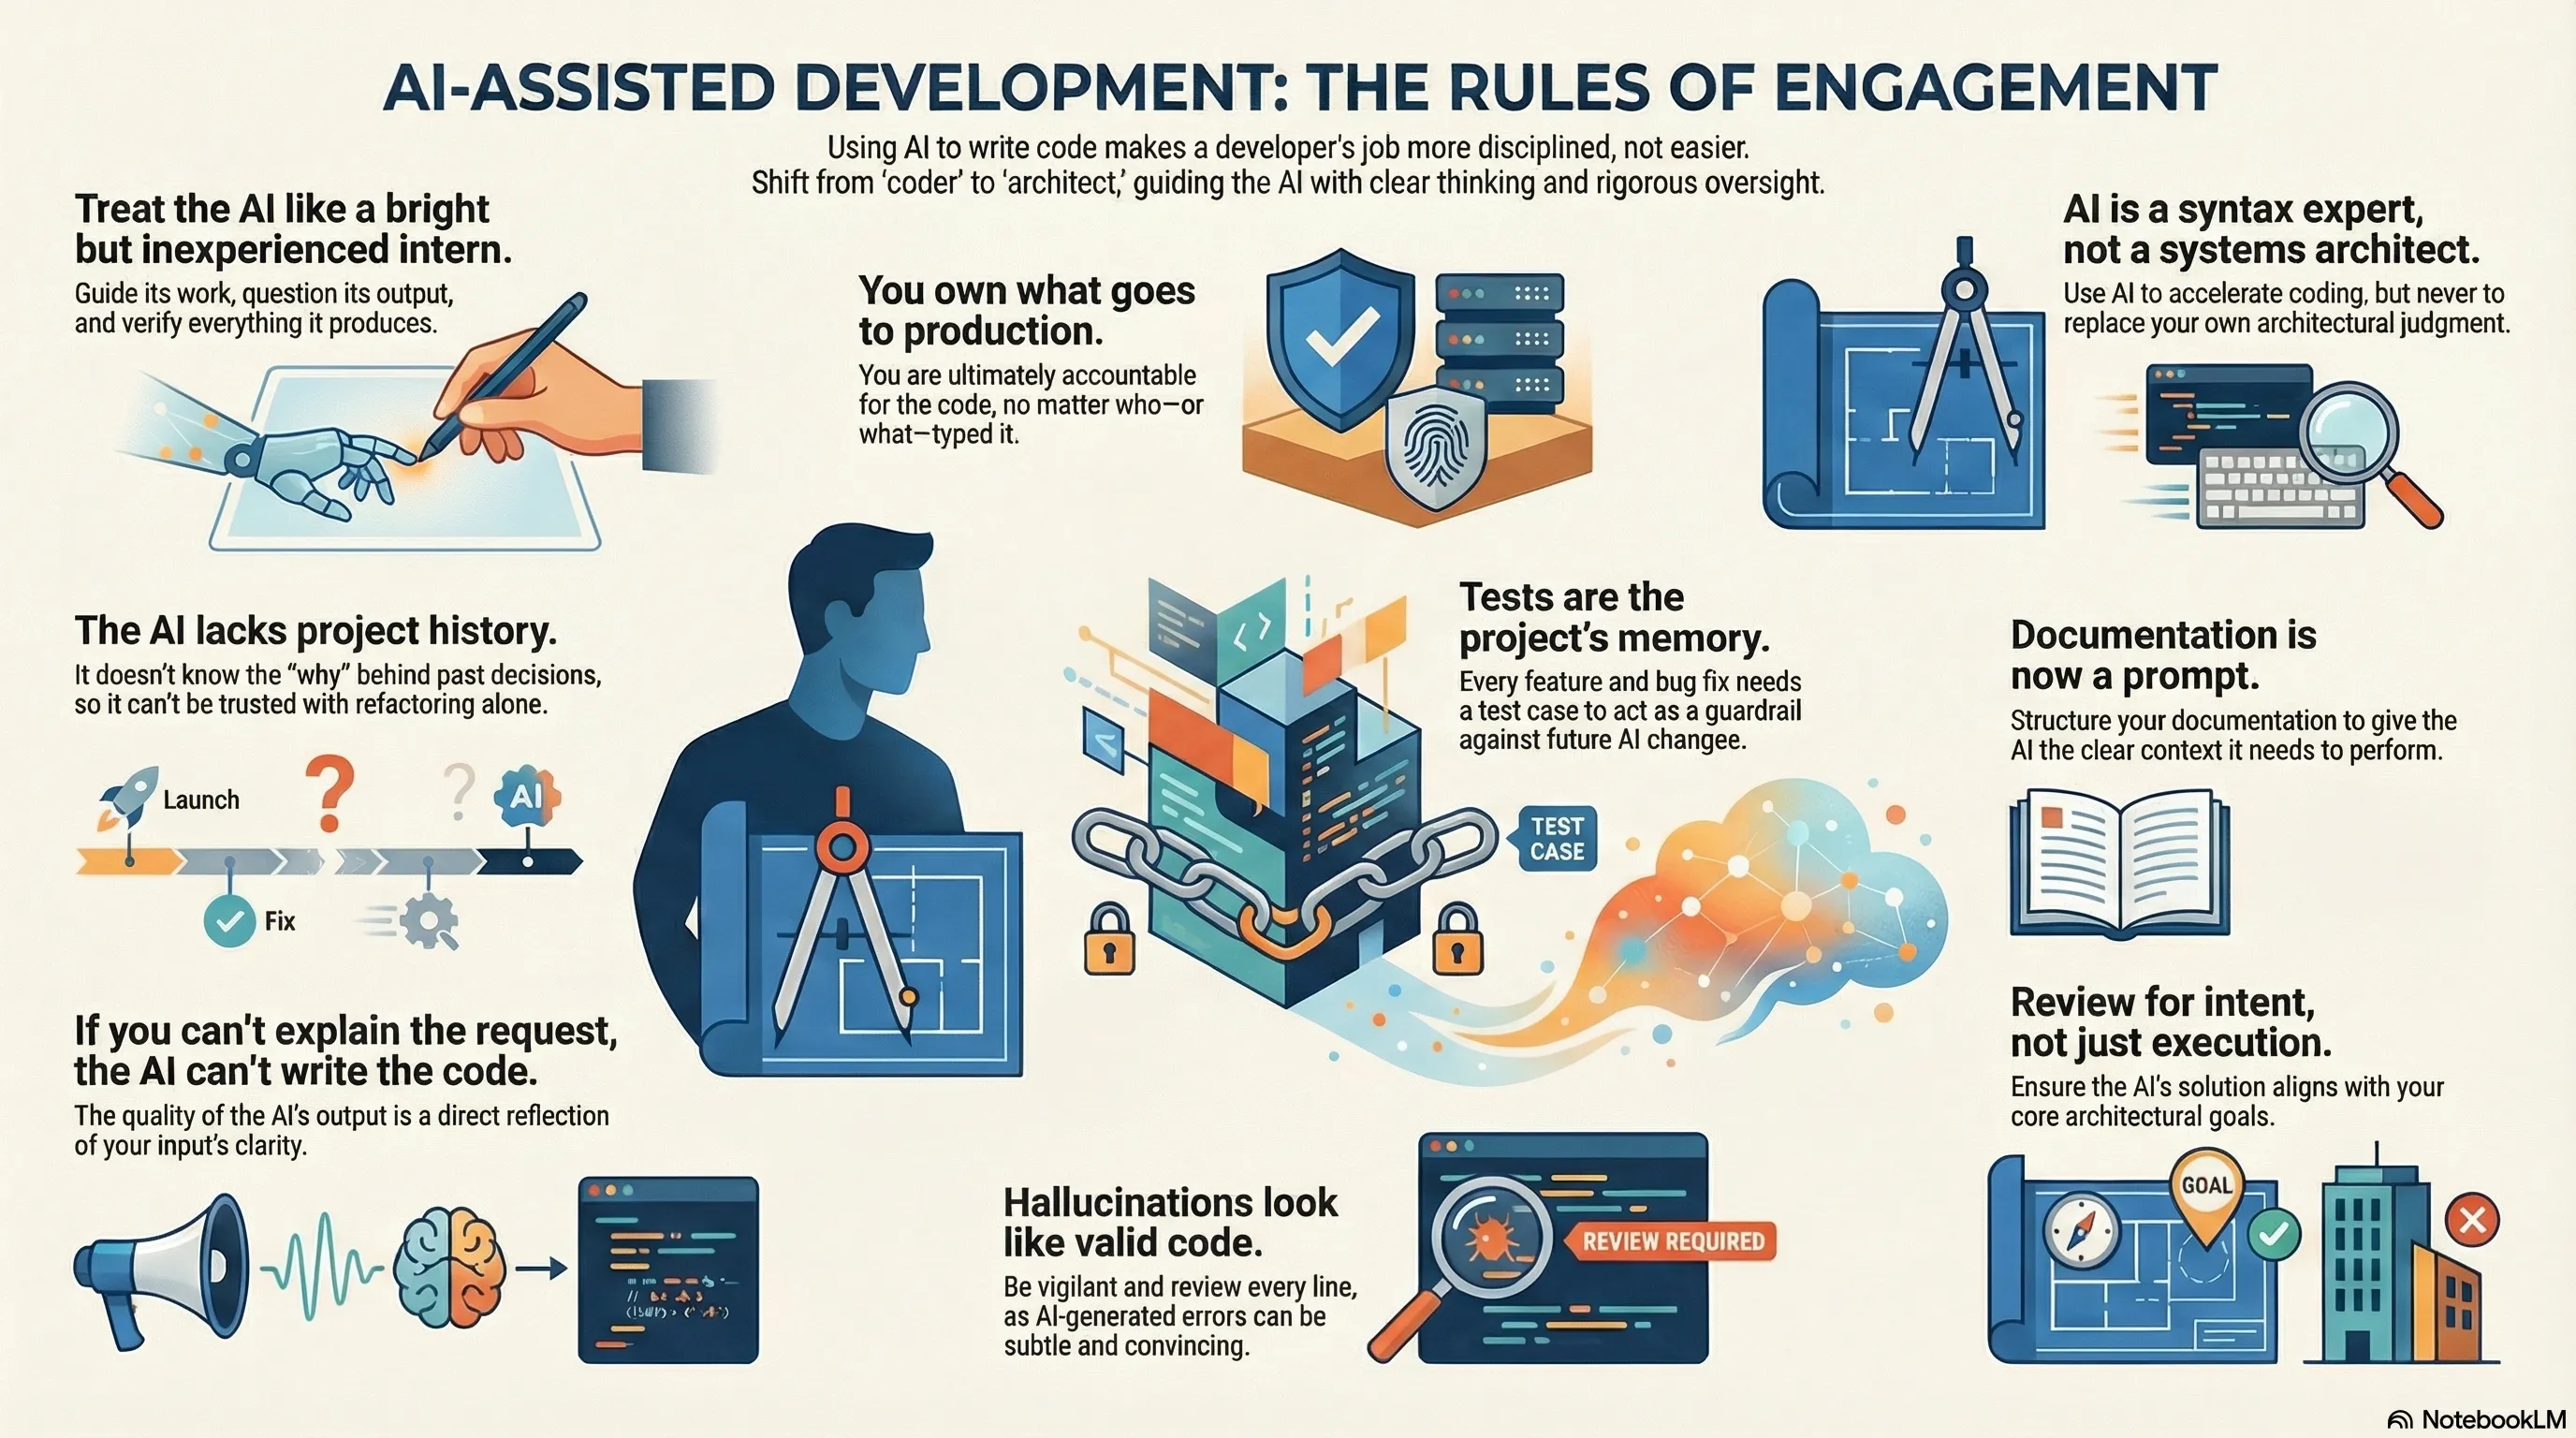
TL;DR: I recently undertook a project that terrifies most engineers: rewriting a massive, critical infrastructure automation tool from scratch. I moved from legacy Bash to Python without writing a single line of manual code - relying entirely on AI agents. Here is how I managed the risk, the architecture, and the “memory loss” of LLMs to build a production-grade tool. The Stakes This wasn’t a simple CRUD app. This tool manages infrastructure for multiple teams. A logic error here doesn’t just throw a stack trace; it could wipe an entire environment or cause immediate customer impact. ...
⬅ Back to Intro | Next → Part 8 - JWT and End-User Authentication 💡 This post is part of my Istio Hands-on Series — a practical journey into Kubernetes Service Mesh. Each post builds on the previous one with hands-on labs, real command outputs, and clear explanations aimed at learning Istio by doing, not just reading. Objective In this post, we’ll: Enable and verify mutual TLS (mTLS) between services Apply AuthorizationPolicies to control access Test what happens when policies block or allow traffic By the end, your frontend–backend app will communicate securely - every request encrypted and identity-verified. ...
⬅ Back to Intro | Next → Part 7 - Security with mTLS and AuthorizationPolicies 💡 This post is part of my Istio Hands-on Series — a practical journey into Kubernetes Service Mesh. Each post builds on the previous one with hands-on labs, real command outputs, and clear explanations aimed at learning Istio by doing, not just reading. Objective: In this post, you’ll learn how to set up distributed tracing in Istio using Jaeger. ...

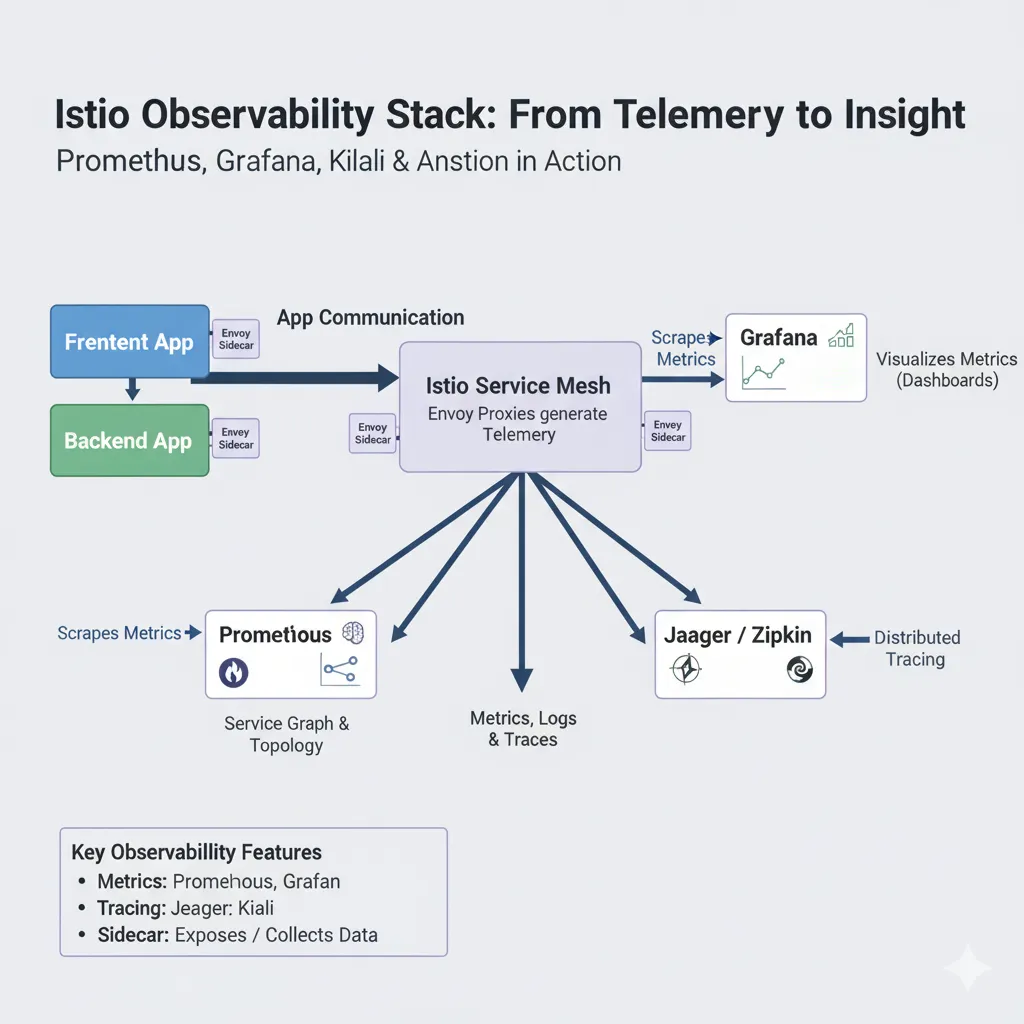
⬅ Back to Intro | Next → Part 6 - Security with mTLS and AuthorizationPolicies 💡 This post is part of my Istio Hands-on Series — a practical journey into Kubernetes Service Mesh. Each post builds on the previous one with hands-on labs, real command outputs, and clear explanations aimed at learning Istio by doing, not just reading. Objective In this post, you’ll set up and explore Istio’s observability stack — powered by: ...